Color Consistency – starting with how accurate is your measurement system using a Gauge R&R study
Appealing packaging is important for a brand. After all, studies have been proven that the ability of the packaging to attract consumers’ attention directly impacts the sales of the product. However, an appealing look is only part of the story. It is also significant for a brand to maintain its appearance consistency. Consistency allows consumers to recognize the brand and to increase brand loyalty.
“A global brand must have a consistent color regardless of the manufacturing location, and packaging must be produced using the same formula and action steps. There must accurate reproduction on a variety of substrates, on multiple types of equipment, run by a variety of people. Using multiple different processes in all types of environment” FTA Magazine, April 2019. A Common measurement use is the of Delta E.
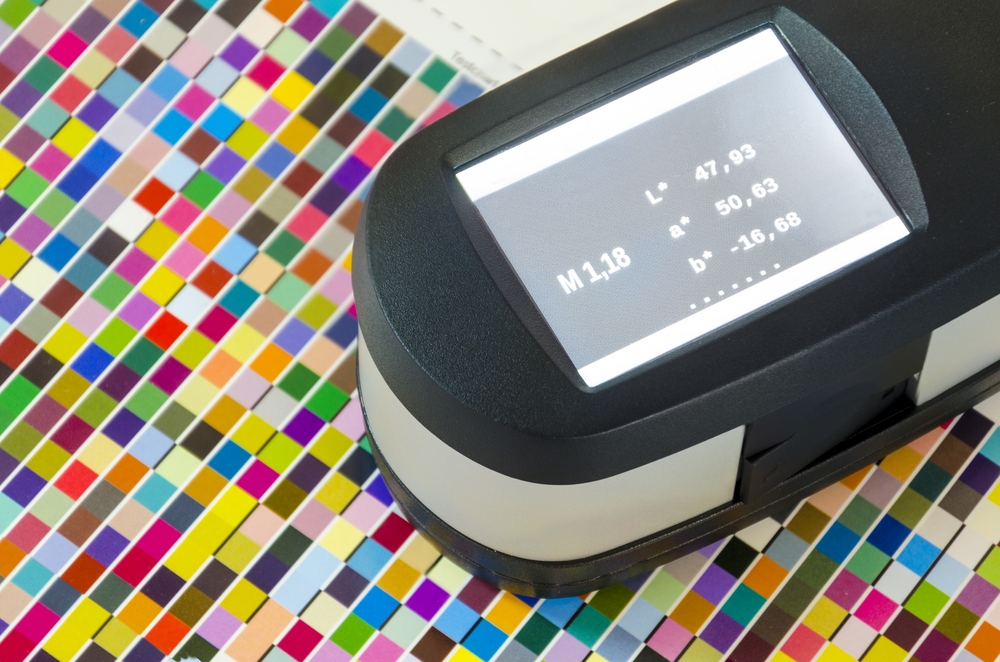
So what is Delta E? Delta E is a metric to quantify how the human eye perceives color difference. It is used to measures the difference between two colors. One color is the target that we are aiming for, and the other color is what we have produced on the printing floor. Ok, so how do we measure color? When measuring color we can use three variables, that is L*a*b*. “L” is the measure of lightness, “a” is the intensity of the red/green value, and “b” is the intensity of the blue/yellow value. You can see L*a*b* as a point on a geographic coordinate- longitude, latitude and altitude, as illustrated below(Figure 1). Delta E is defined by the formula below.
Figure 1

In general, a Delta E that is smaller or equal to 1 is not perceptible by the human eyes. A Delta E of 1-2 is perceivable through close observation. A Delta E or 2-10 is perceivable at a glance. Most converters are working a or below 2 Delta E.
Ok, now that we know to use Delta E to measure how far is the production away from the target. We should take one step back and evaluate how accurate is our measurement. If you don’t have a decent measurement system, then the conclusion that you are going to draw upon are bound to go wrong.
Gauge R&R study is a statistical analysis to measure the competence of your measurement system. R&R stands for repeatability and reproducibility. Repeatability tells you how much variability in the measurement system is caused by the measuring device. In our case, it is usually the spectrophotometer. Reproducibility tells you how much variability in the measurement system is caused by the differences between operators. Let’s walk through an example. There are 3 appraisers or operators, A, B, and C, to conduct a L*a*b measurement 3 times, Trial 1, 2 and 3 using 5 different spectrophotometers, Part 1, 2, 3, 4 and 5 to get the following result (Table 1)

Using the data above an R&R figure can be drawn. Then use this R&R figure to compare it with the total variation. A general rule of thumb, if the R&R figure is under 10% of the total variation (let’s call it %GRR), then measurement system is acceptable. If the %GRR is 10%~ 30%, then the measurement system may be acceptable based on the application. If the %GRR is 30% then the measurement system needs improvement.
Source: https://www.spcforexcel.com/knowledge/measurement-systems-analysis/variable-measurement-systems-part-4-gage-rr