Why your A/B testing results may be false?
In the digital age, and with the support of technology. Testing has become very popular in the business environment. Business setup up different groups to target a goal and try to find a group that will produce the best result. This type of setup is called A/B testing. The goal that you are trying to reach should have a meaningful purpose. I found that many businesses set up goals that lack a meaningful purpose. For instance, finding out that we have more male customers than female customers. Our customers are mainly located in Taipei city. Ok, great and then? How is this information going to help the business? How to set up a meaningful goal is out of the scope of this article, but in general, you should try to tie your goals to business profits.
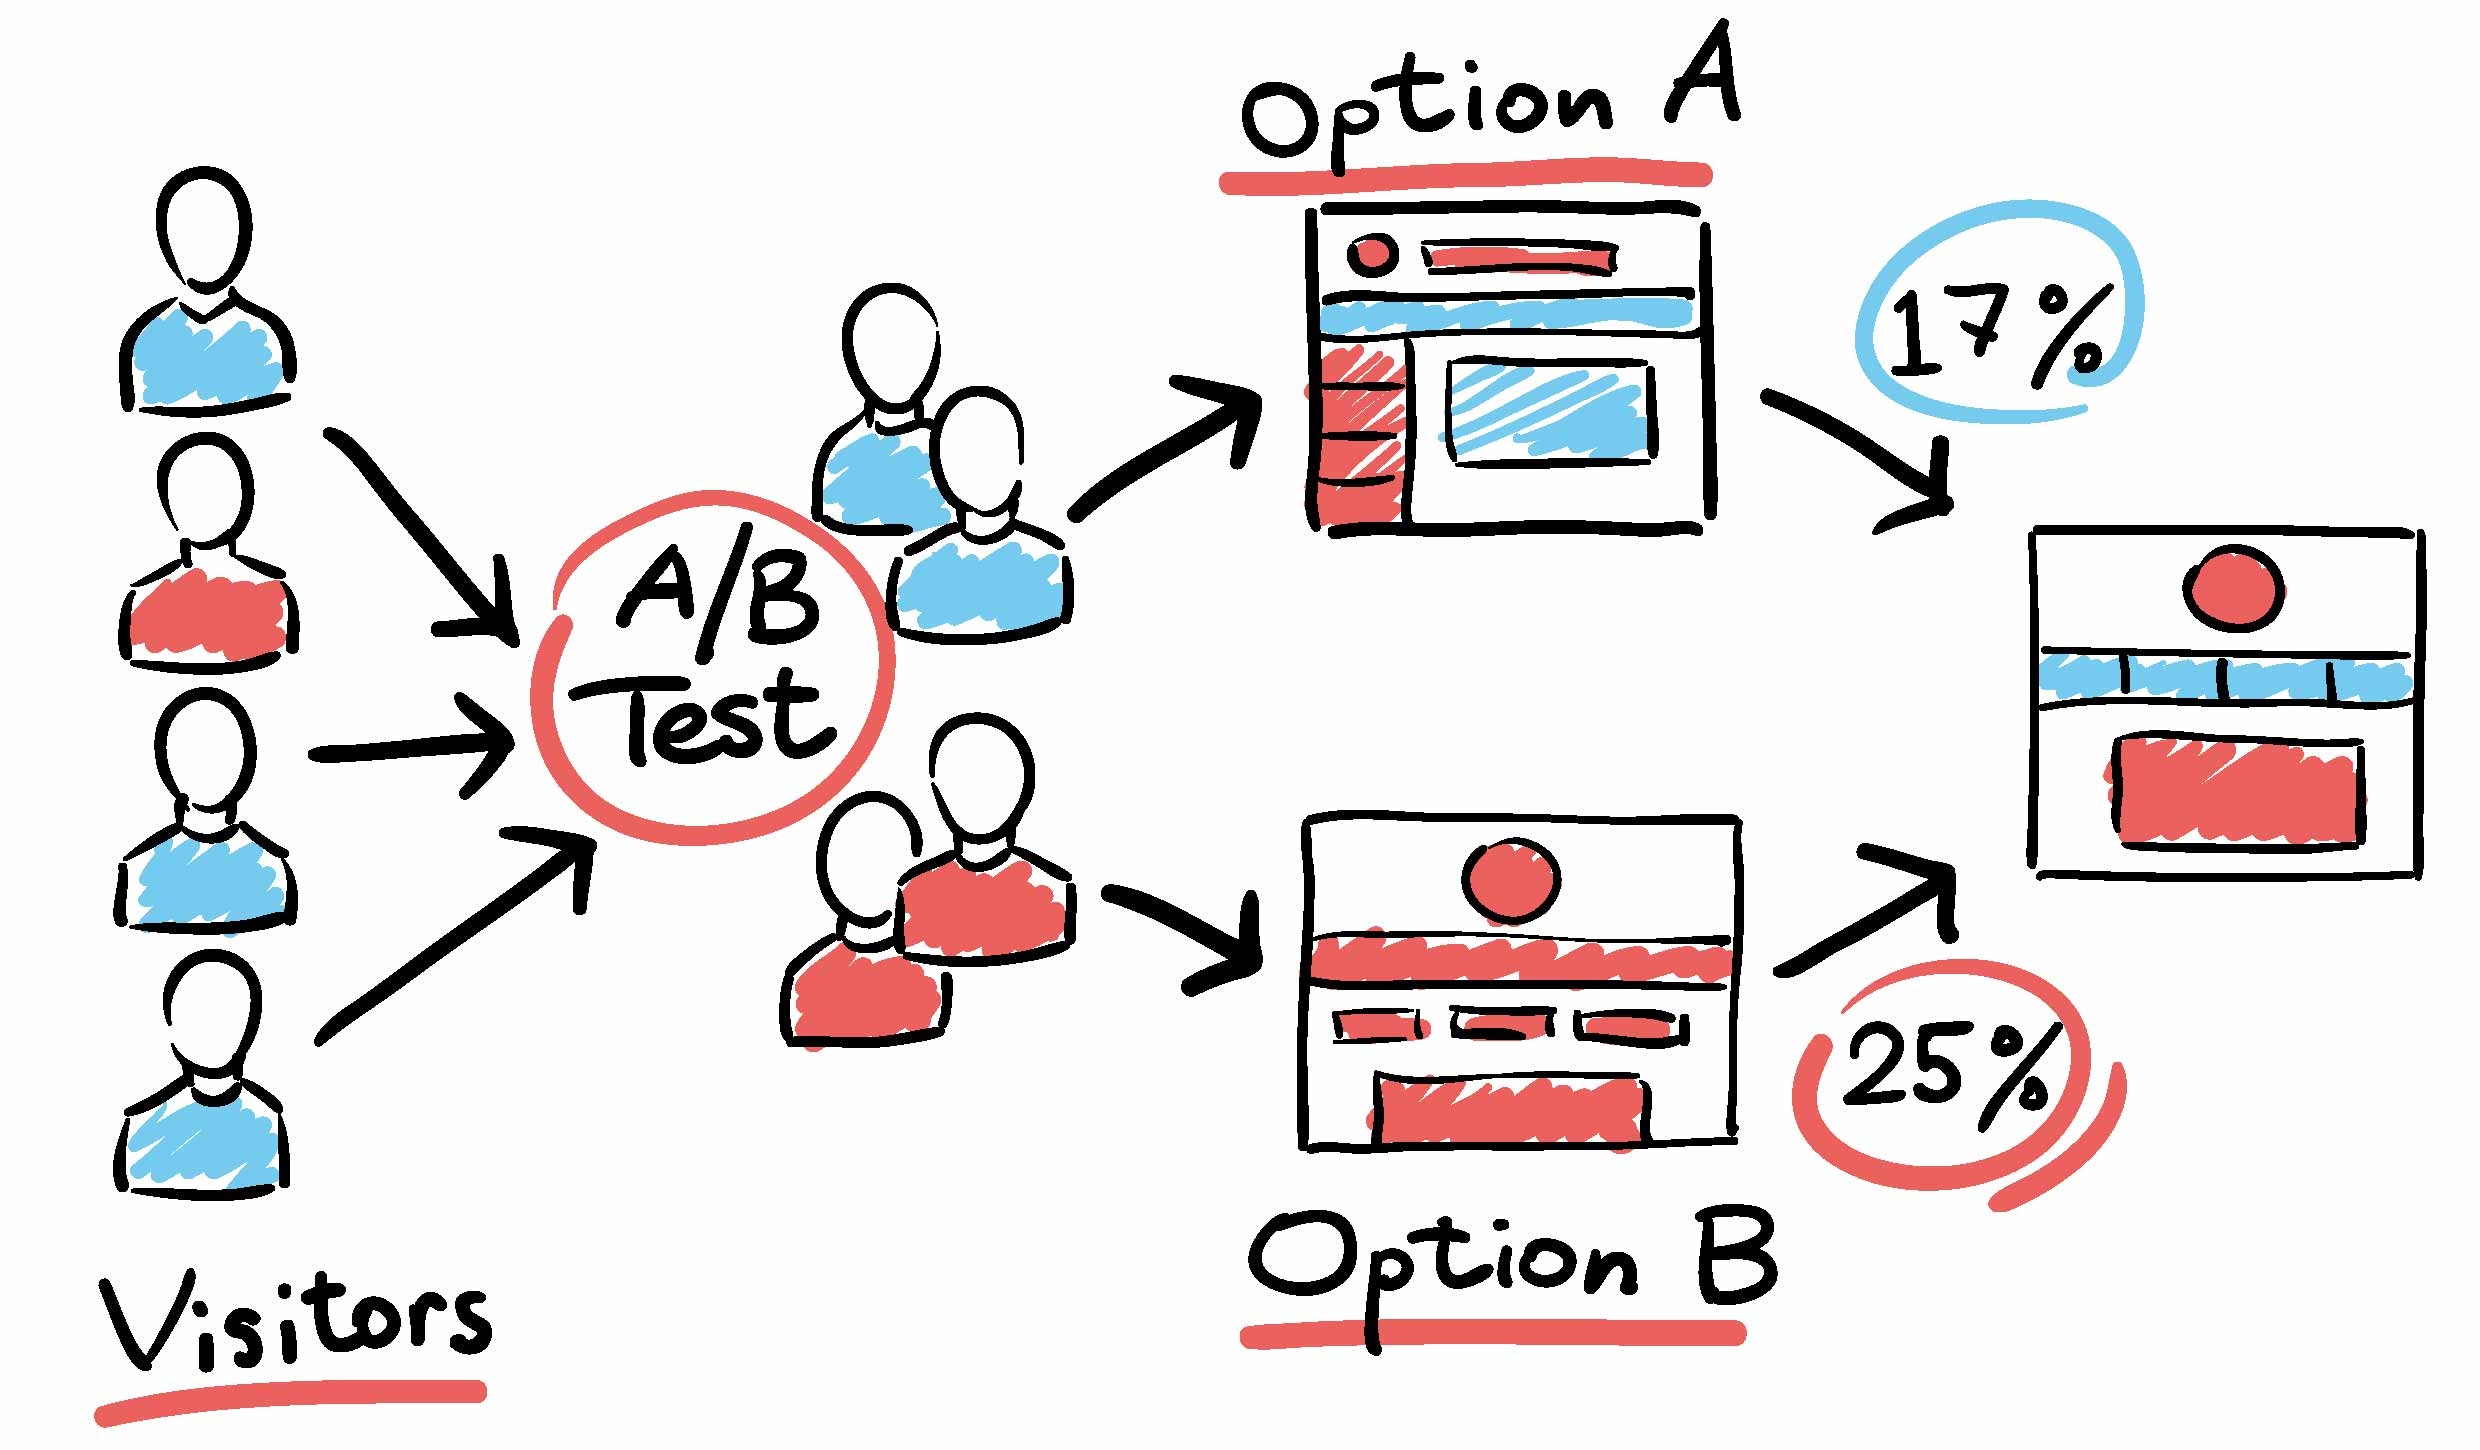
Ok, going back to our topic on A/B testing result. A/B testing is used very commonly in businesses today. In the sales and marketing field, businesses produce different banners on the website and observe which one has the best click-through rate. Businesses produce different content in their email campaign to observe which type of content will lead to the most conversions. In the customer service field, businesses provide different customer service levels and try to conclude if the different customer service levels will affect the retention rate of the customer…etc. The application could be found in many areas.
Let's say, at the end of the day, we get to the conclusion that A is better than B for achieving the target goal. However, have you considered the error in your statistical analysis? What is the chance that A is better than B because of error? In other words, A is better than B in your test due to statistical error. In reality, A is not better than B. For instance, you come to the conclusion that A is better than B. However, there is a 50% chance that this result is caused by error. In this case, you cannot jump to the conclusion that A is better than B and will need to increase your sample size. How to pick your sample is also another big topic but we will not discuss it in this article. In general, we always try to achieve “random sampling” within a controlled group. I found that most company that performs A/B testing never get to the stage of validating their result. Never validating the chance that the result is caused by an error and does not reflect the truth.
Ok, let’s go into more details about how you calculate your “chance of error”. In general, you can assume a normal distribution. You make a claim, which we call the Null Hypothesis, denoted as H0. The null hypothesis is the formal basis for testing statistical significance. To state a proposition that there is no association. For instance, we can’t claim that campaign A is better than campaign B. Then there is the alternative hypothesis, denoted as H1. The alternative hypothesis proposes that there is an association. The alternative hypothesis cannot be tested directly. It is accepted by exclusion if the test of statistical significance rejects the null hypothesis. Under this scenario, can you get two types of error: type1 and type2. Type 1 error is when you reject the null hypothesis when the null hypothesis is true. Type 2 error is when you fail to reject the null hypothesis when the null hypothesis is false. Type 1 error is also called the p-value. For instance a p-value of 5% indicate the there is a 5% chance that you are wrong when you reject the null hypothesis.
Therefore always calculate the value of the Type 1 error, to help you draw a conclusion on whether your result is likely to reflect the truth or is whether it is caused by an error.
Article by Daywey Chen, KYMC